What exactly can this function do?
To enable you to create effective analyses, the dashboard provides a good overview of app activities, your campaigns, and incentives.
- You can launch campaigns continuously and receive a detailed report on all campaigns sent.
- You can divide your customers into segments or manually merge them into a segment.
Possible evaluations:
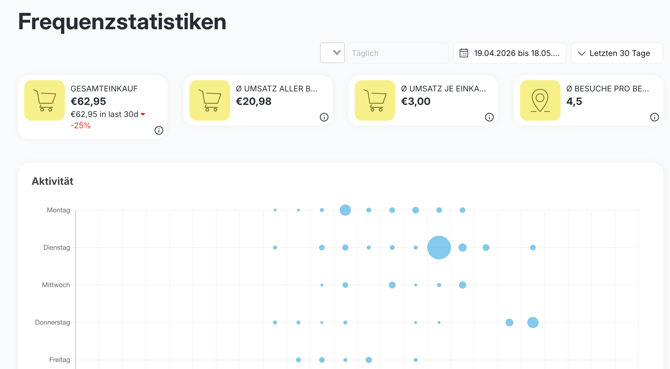
- Frequency: how often do your customers visit per year?
- How many stores do customers visit on average?
- Which product groups are purchased? (only if products are available)
- Shopping cart / Annual sales and average customer
- How old are your customers?
- App usage (downloads, registrations, which screens are popular, etc.)
The added value for you
- Through a wide variety of analyses, you will get to know your customers really well and can respond directly to their wishes and needs.
- You can clearly evaluate the success of all activities, such as campaigns.
- Segmentations (link feature) are also possible, as are evaluations for a specific segment.
- Many different possible analyses offer you a good opportunity to find out about your monetary success, awareness, customer behavior, and much more.
Images / Screenshots
The functions in detail
Further evaluations:
- Download statistics for your apps by operating system
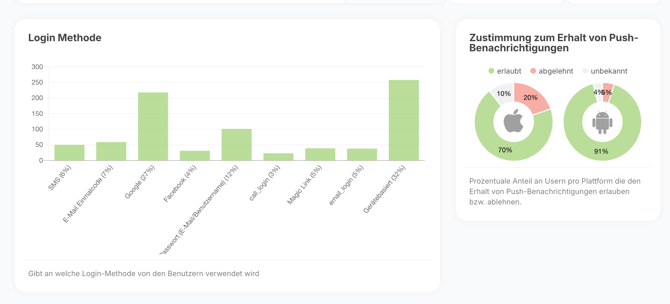
- Consent rates for notifications by operating system
- Report on the use of different login methods
- Demographic statistics on the gender and age of your customers
- Frequency statistics with visit frequency of your branches
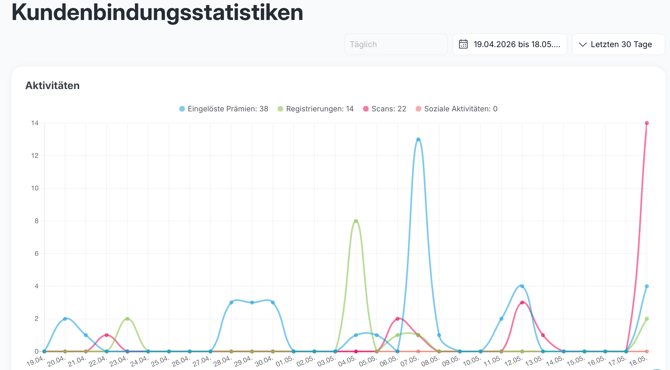
- Statistics on points collected and rewarded interactions
- Statistics on redeemed rewards
- Customer loyalty statistics based on points history
- Social share statistics
- Segmentable reports that give you deeper insight into the behavior of your user groups
- Reports can be flexibly restricted by time period.